
Objective
- To develop a user interface that displays information about frames.
- To predict for each frame if the quality is good enough to use a shortcut during the process.
Environment & constraints
- Being able to connect to existing tools, machines and databases.
- Being able to scale up (around 40 Mo of new data incoming everyday)
- Being able to build a prediction model that could have good accuracy on 25 000 ++ references with direct impact on production performance.
- Organize smart design of experiments to minimize the cost (to build our training data set).
- Have to integrate the tool in the middle of information and production data chain.
Achievements
- Concept creation and uphill validation.
- Automatic retrieving of data from tracing machines (live from production site). More than 4000 files per day.
- Extraction of meaningful data from measurement files (oma files).
- Extraction of data from production system.
- Merging data from different sources to create a brand new database around frames and their features (measurement, characteristics, suppliers, volume, etc …).
- Definition and calculation of new features around frames and their quality.
- Data analysis + Data visualization (first conclusion around frames).
- Design of experiment : launch of experiments to evaluate the responses of different frames regarding a special mounting process.
- Machine learning : from the experiments, prediction model building on how the other references will respond to our new mounting process (deep neural network implementation).
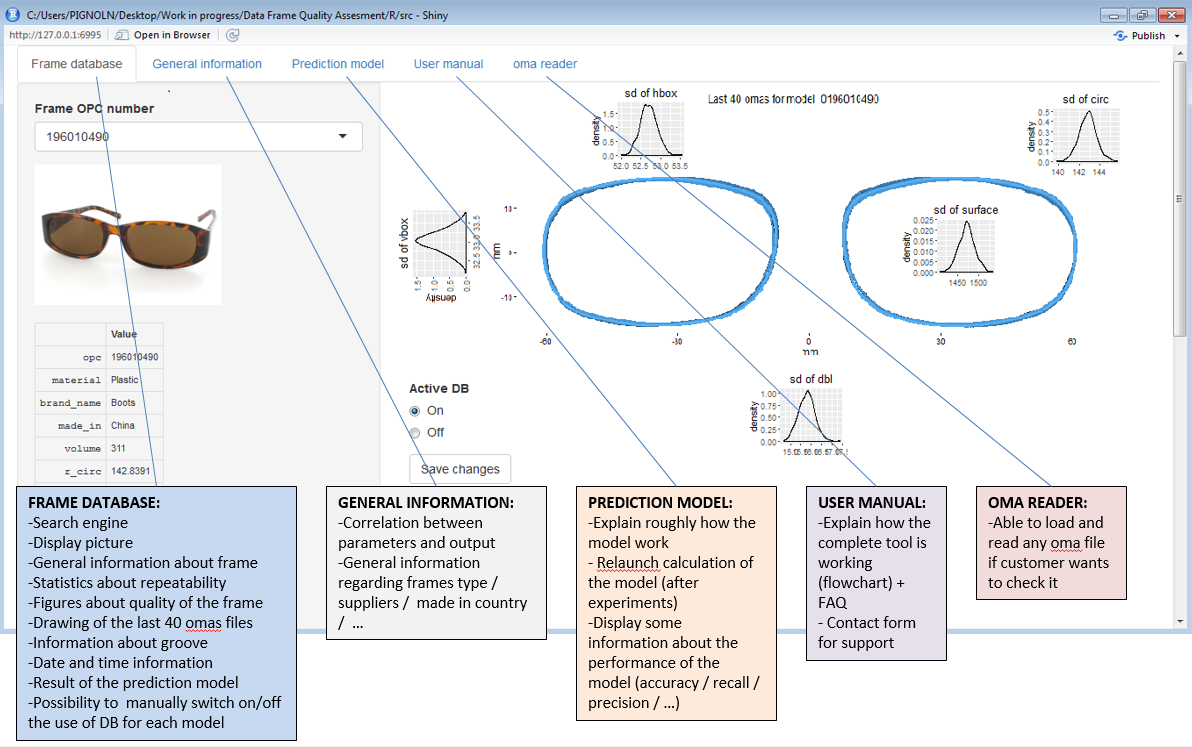
- User interface definition and creation for final users : production, management, quality, and business with live upgrade of data and prediction results.
Here is one screenshot of what it looks like at the end :
Pieces of code (R script)
Deature extractor from oma file.
SQL Database management with R and SQL
User interface using shiny.
and more…