In this page I am proposing a way to tackle the complexity of flows in a company, in order to help business to have better insights of their processes.
These methods could be applied to any type of process flow: financial, physical (materials, products, spare parts) or human. I am not digging too much into details and one should consider this page as general guideline.
Aim of this study is to reduce the WIP (Work in Progress) and TAT (Turn Around Time or Lead Time) of individuals being kept in a process.
We are supposing that one has access to a great quantity of data representing each movement of an individual in a given process (with timestamp, steps and type of movement).
Source : https://en.wikipedia.org/wiki/Turnaround_time
-
Sampling methods
Population of our dataset may be large. Some of the algorithms that we are going to use are heavy consumer of computational power. Therefore, we are proposing to sample our data in order to work on a smaller dataset. Sampling step can be delicate. We do want to choose a sample that represents our population properly. Several technique of sampling are existing but in the case of a large dataset a random sampling technique is often appropriate.
Random sampling and sampling size justification.
If we have access to a nice quantity of data, we do not really needs to optimize our picking method (with pre identified clusters).
Sample size justification : theory
R script. Generate un mix of Gaussian variable and try to find a value from which our sampling method hits a plateau.
Theorically, a sample size of just 30 elements is a good representation of our population. In reality, we choose the biggest sample size that allows our algorithms to run in an acceptable amount of time.
-
Adjacency matrix
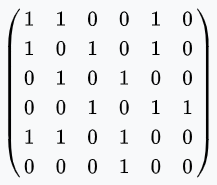
In order to build algorithm, we need to represent our flows as mathematical object. Flowchart or graphs can be written as an adjacency matrix. In our case, links between storage locations are represented by a 1 when vertices are adjacent in our flowchart and by a 0 when connections between nodes are inexistent. Here is a small example of how such matrices are built:
Having the following process map
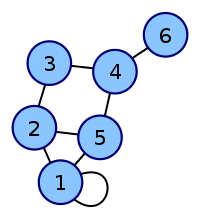
It can be represented by the following matrix
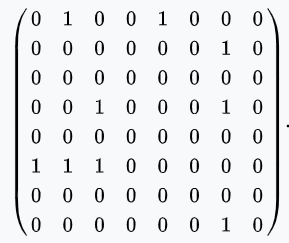
Flowchart graphs can be oriented. In this case, adjacency matrix may not be symmetrical. Here is an example of a flowchart with oriented flows :
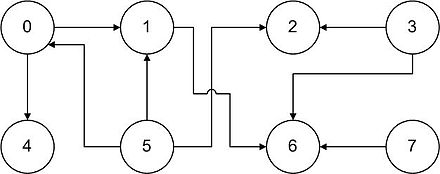
And its related matrix
Source Wikipedia : https://en.wikipedia.org/wiki/Adjacency_matrix
We want to build an adjacency matrix for each element of our dataset. Each matrix will have columns and rows with every node of our dataset.
-
Distance matrix
Now that we could represent the flow of every elements in our dataset, we would like to define a way to measure of how similar or how different they are from each other. We then need to choose a norm to assess the distance between 2 elements.
Different definitions are available :
- Euclidean norm 1
- Euclidean norm 2
- Eucldiean norm n
- Foebius norm
- Etc…
I am only focusing on the Euclidean norm definition.
-
Euclidean norm L2 and Ln
We are introducing the Euclidean distance with dimension n as follow:
Having matrices A=(aij) and B=(bij) we can define the following measure of their relative distance.
N=2 and then we have Euclidean norm L2.
-
Distance matrix calculation
We can now create the distance matrix. Each element being an individual in our process, we are displaying distances of one element to every other element. This matrix is symmetrical and has zeros on its diagonal.
-
Dimensionality reduction: t-SNE vs PCA vs Umap
We would like to find a way to plot our elements in reduced space, having elements with similar processes close and elements with distant processes being far from each other. We would like to represent our elements in a 2D or 3D space, thus reduce from N to 2. Several space dimension techniques exist and we are only focus on 2 of them here: PCA and t-SNE.
PCA: Principal Component Analysis. PCA is a linear combination of the original variables. Principal components are extracted such as the first principal component explains maximum variance in the dataset. Second principal component tries to explain the remaining variance in the dataset and is uncorrelated to the first one. Good when having a large number of variables.
PCA is not able to interpret complex polynomial relationship between features
t-SNE: t_distributed stochastic neighbor embedding.
It is a nonlinear dimensionality reduction technique.
2 main approaches:
- Local approach: maps nearby points on the manifold to nearby points in the low dimensional representation
- Global approach: attempt to preserve geometry at all scales. Nearby nearby, far away far away.
- t-SNE is one of the few algorithms which is capable of retaining both local and global structure of the data at the same time
PCA (Principal Component Analysis) vs t-SNE (t-distributed stochastic neighbor embedding)
Both are used for dimensionality reduction
- PCA is deterministic, t-SNE is not.
- Interpretability of mapping.
- Application to new unseen data
t-SNE more insightful understanding :
Expected result
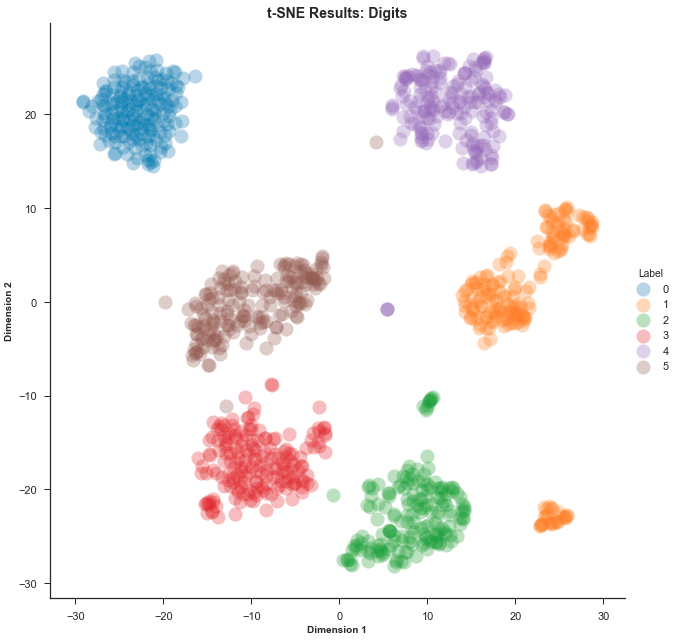
We have 6 different well separated clusters. The idea now, is to try to link these clusters with business oriented clusters, therefore analyze the individuals within our clusters and try to define them with business features.
source : https://en.wikipedia.org/wiki/T-distributed_stochastic_neighbor_embedding
-
Removing outliers
-
Automatic clustering: Gaussian Mixture Model vs Kmeans
After tsne vs before tsne
Pros and Cons
-
Visualization of clusters (2D and 3D)
-
Models
Random Forest Model
Decision Tree
Segmentation and threshold values
Model performance
-
To predict cluster belonging :
We would like to define a model that predict a cluster affiliation from a series on inputs. I choose to have series of node has
-
To predict time consumption
-
Analysis and conclusions
-
% of data in nicely defined clusters
Few indicators are interesting to build here. We would like to asses the quality of our clustering and to define more or less what these clusters are representing.
-
Visualization of clusters
-
TAT calculation propositions
Once our clusters are well defined, we can plot the process maps they correspond to and propose a way to position our milestones and assess our different TAT.
We applied this method to study flows of parts in a company and the results were quite outstanding.
-
WIP and TAT analysis
-
References / papers
https://distill.pub/2016/misread-tsne/
https://towardsdatascience.com/gaussian-mixture-models-explained-6986aaf5a95
https://towardsdatascience.com/how-to-cluster-in-high-dimensions-4ef693bacc6